
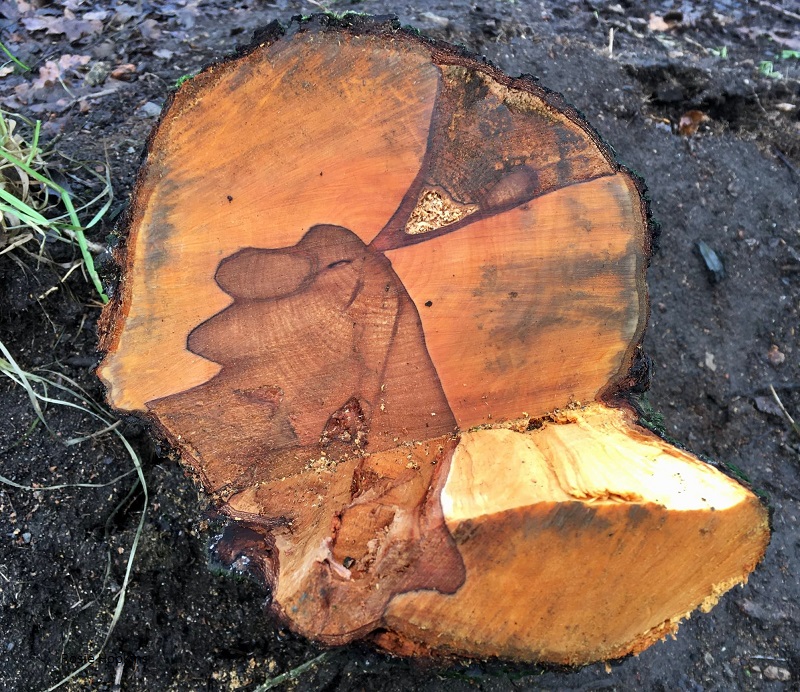
Counting the rings in a piece of sawn wood or Dendrochronology can show the exact year they were formed. New growth in trees occurs in a layer of cells near the bark. A tree’s growth rate changes in a predictable pattern throughout the year in response to seasonal climate changes, resulting in visible growth rings. Each ring marks a complete cycle of seasons, or one year, in the tree’s life.

Trees can give information about the past climate. The light-coloured rings represent wood that grew in the spring and early summer, while the dark rings represent wood that grew in the late summer and autumn. One light ring plus one dark ring equals one year of the tree’s life.
Because trees are sensitive to local climate conditions, such as rain and temperature, they give scientists some information about that area’s local climate in the past. For example, tree rings usually grow wider in warm, wet years and they are thinner in years when it is cold and dry. If the tree has experienced stressful conditions, such as a drought, the tree might hardly grow at all in those years.
Tree rings provide snapshots of Earth’s past climate, NASA, Global Climate Change
Trees can also tell us more about the history of a place or of a building.
A vast study by a consortium of scientists across Europe, published in Frontiers in Ecology and Evolution, has examined timbers as a way of tracking the economic conditions of Medieval Europe.
By dating timber from tree rings – to the exact year of felling – from historical buildings, and statistically analyzing the distribution of building years, the authors deduce multiple periods of socio-economic prosperity and downturn between 1250 and 1699, independent from other historical data. Crucially, they show how different European regions were differentially affected, and at different times.

Dr Fredrik Ljungqvist, associate professor of both History and Physical Geography at Stockholm University, Sweden, explained:
“The ability to reconstruct changes in building activity in time and space, independent of written sources, provides valuable new insights into times of crisis and prosperity in the past.
“Here we show that felling dates are a good indicator for changes in societal wellbeing and demographics.”
Ljungqvist et al. analyzed felling dates from 54,045 georeferenced pieces of building timber – oak, fir, pine, larch, and spruce. They exclusively used wood for which the outermost (youngest) tree ring was preserved, allowing precise determination of the felling year through comparison to the dendrochronological record.
They compared changes in building activity between the British Isles, the Nordic countries, France, the Benelux countries, Switzerland, and the northern and southern parts of central Europe throughout the late medieval and early modern era. They also looked for associations with other reconstructed economic and environmental measures, for example the price of grain and wine, consumer price indices, growing season temperature, soil moisture availability, and groundwater level.

The authors find clear evidence in the record of felling dates for the so-called ‘Late Medieval Crisis’, the devastating Thirty Years’ War (1618-1648), and known economic boom periods in the late 13th century and around 1500.
They show that building activity tracks the historical price of grain, a staple whose price had a major impact on the economy and standard of living. Periods of intense building also coincided with known peaks in lead pollution in ice-cores, a proxy for historical mining activity.
Dr Ljungqvist, continued:
“Building activity showed an unprecedented decrease in much of Europe during the Thirty Years’ War. Differences in the magnitude of the decrease agree remarkably well with the known magnitude of the population decrease due to war in different regions of Germany. This shows that our reconstructed building activity history accurately captures demographic changes.”
A key finding is the low overall degree of synchronicity in building between regions, except for a strong assocation between southern and northern parts of central Europe, and southern central Europe and the British Isles. Another is that periods of low building activity occurred during known alpine glacier maxima (c. 1300-1370 and 1600-1670) during the Little Ice Age.
Future research will continue this fascinating look into the past.
Dr Andrea Seim, from the Institute of Forest Sciences at the University of Freiburg in Germany, said:
“Future work could compare felling dates with a variety of historical documentary sources and environmental proxies to understand past forest management and resource utilization. Moreover, felling dates from wooden archeological material, which can be preserved for millennia, can provide new insights into settlement dynamics in prehistoric times where we lack written sources.”
“Regional patterns of late medieval and early modern European building activity revealed by felling dates” is published in in Frontiers in Ecology and Evolution


Leave a Reply