
By Steve Drury First PUBLISHED ON August 10, 2021
Since the start of 2020 I doubt there has been much field research. But such a vast amount of data has been amassed over the years that there must be opportunities to keep the academic pot boiling. One way is to look for new correlations between different kinds of data. For instance matching the decades-old time series of extinctions with those of other parameters that have changed over geological time. At a time of growing concern about anthropogenic climate change a group based at the State Key Laboratory of Biogeology and Environmental Geology, at China University of Geosciences, Wuhan have checked the extinction rates of marine fossils over the last 450 Ma against variations in sea-surface temperature (Song, H. et al 2021. Thresholds of temperature change for mass extinctions. Nature Communications, v. 12, Article number 4694; DOI: 0.1038/s41467-021-25019-2).
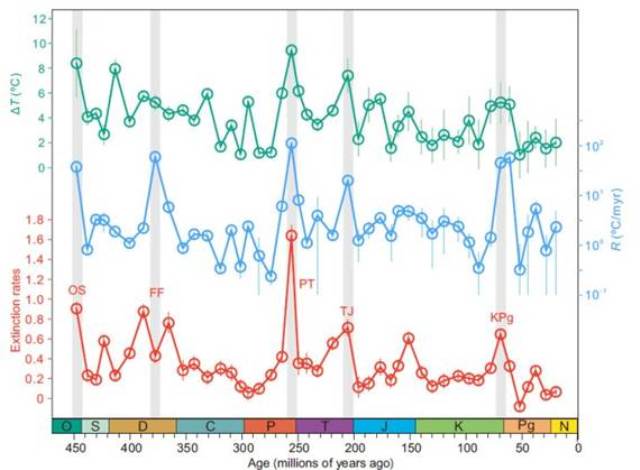
Extinction data are usually presented in time ‘bins’ based on the number of disappearances of fossil genera in one or a number of geological Stages – the finest divisions of the stratigraphic column. The growing data set for sea-surface temperatures derived using oxygen isotopes from marine fossil shells is more continuous, being derived from many different layers of suitable sedimentary rock within a Stage. Clearly, the two kinds of data have to be expressed in a similar way to check for correlations. Haijun Song and co-workers converted both the extinction and temperature time series to 45 time ‘bins’, each around 10 Ma long. They express the binned climatic data in two ways: as the largest temperature change (°C) and the highest rate of temperature change (°C Ma-1) within each bin. That is, they expressed to some extent the greater continuity of seawater temperature data as well as matching them to those for extinctions.

There are good correlations between the climatic and extinction data, particularly for mass extinctions. Bearing in mind that mass extinctions take place far more rapidly than can be expressed with 10 Ma time bins, the authors were concerned that bias could creep into the binned extinction data. They were able to discount this by examining both data sets in finer detail at the times of the ‘Big 5’ extinctions. Earlier research had identified warming episodes around the times of each mass extinction, often implicating greenhouse-gas emissions from Large Igneous Provinces. Yet there are other factors that may have influenced the 7 ‘lesser’ mass extinctions in the fossil record. The authors are sufficiently confident in the correlations they have revealed to suggest thresholds that seem to have launched major mass extinctions: greater than 5.2 °C and 10 °C Ma-1 for magnitudes and rates of sea-surface temperature change, respectively.
In the context of the modern climate, the data analysis predicts that a rise of 5.2 °C above the preindustrial mean global temperature spells extinctions of ‘Big Five’ magnitude. The current rate of temperature increase – 0.8 ° per decade – is hugely faster than that expressed by the data that span the last 450 Ma. This is more alarming than the stark Sixth Report of the Intergovernmental Panel on Climate Change IPCC released on 9 August 2021.
If you’d like to read more of Steve’s blog………. https://earthlogs.org/homepage/
Many thanks to Steve Drury for permission to republish his article and to Bernie Bell for sending it into The Orkney News


Leave a Reply